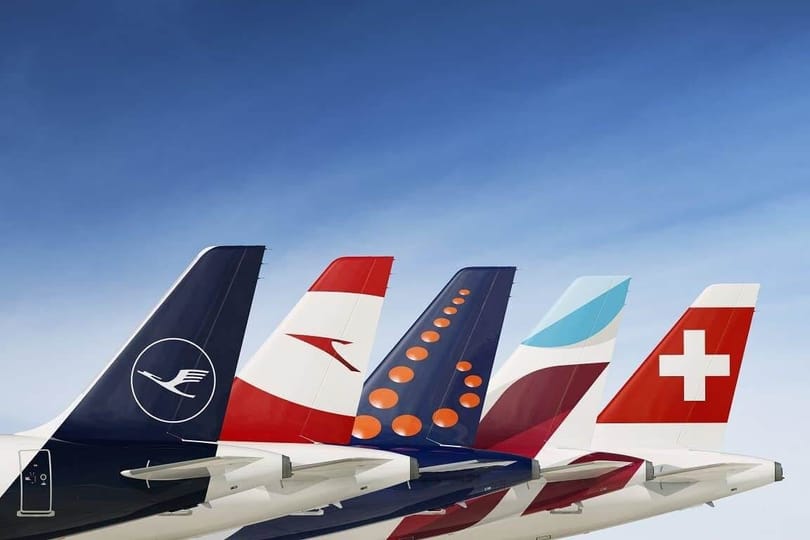
Na August 2019, ndị Lutù Lufthansa airlines welcomed more than 14.1 million passengers. This shows an increase of 2.9 percent compared to the previous year’s month. The available seat kilometres were up 1.8 percent over the previous year, at the same time, sales increased by 2.7 percent. In addition as compared to August 2018, the seat load factor rose by 0.8 percentage points to 87.2 percent.
Ikike ibu bu 8.9 pasent kwa afo, ebe ire ibu ji pasenti 1.5 gbagoro n'usoro ego ha na-enweta na tonne-kilomita. N'ihi ya, ihe na-ebu ibu na-egosi mbelata kwekọrọ, na-agbada site na pasent 4.2 ruo pasent 58.8.
Network ụgbọ elu nwere ihe ruru nde mmadụ 10.2
Ụgbọ elu netwọk gụnyere Lufthansa German ụgbọ elu, SWISS na Austrian ụgbọ elu carried around 10.2 million passengers in August – 3.3 percent more than in the prior-year period. Compared to the previous year, the available seat kilometres increased by 3.1 percent in August. The sales volume was up by 4.0 percent over the same period, with an increasing seat load factor by 0.7 percentage points to 87.3 percent.
Strongest passenger growth at Zurich hub
In August, the strongest passenger growth of the network airlines was recorded at the Zurich hub with 7.0 percent. The number of passengers increased by 4.7 percent in Vienna and by 4.5 percent in Munich. In Frankfurt the number of passengers on the contrary decreased by 0.9 percent. The underlying offer also changed to varying degrees: In Munich the offer increased by 12.1 percent, in Zurich by 2.6 percent and in Frankfurt by 0.3 percent. In Vienna the offer decreased by 1.0 percent.
Lufthansa German Airlines transported more than 6.6 million passengers in August, a 1.8 percent increase compared to the same month last year. A 4.0 percent increase in seat kilometres corresponds to a 4.8 percent increase in sales. The seat load factor rose by 0.7 percentage points to 86.8 percent.
Eurowings increases supply and sales on short-haul routes
Eurowings (including Brussels Airlines) carried around 3.9 million passengers in August. Among this total, around 3.6 million passengers were on short-haul flights and 309,000 flew on long-haul flights. This corresponds to an increase of 1.8 percent compared with the previous year, resulting from an increase of 2.8 per cent on short-haul flights and a reduction of 8.1 per cent on long-haul flights. A 3.5 percent decrease in capacity was offset by a 2.3 percent decrease in sales, resulting in an increase of seat load factor by 1.0 percentage points to 87.0 percent.
In August, the number of seat-kilometres offered on short-haul routes was increased by 1.5 per cent, while the number of seat-kilometres sold increased by 3.5 per cent over the same period. This results in a seat load factor of 87.1 per cent, which is 1.7 percentage points higher on these flights. On long-haul flights, the seat load factor decreased by 0.4 percentage points to 86.6 per cent over the same period. The 13.4 per cent decrease in capacity was offset by a 13.8 per cent decrease in sales.
| Lutù Lufthansa | |||||
| Ọnwa | M na | Mkpokọta | M na | ||
| Total Lufthansa Group Airlines | Passengers in 1,000 | 14,143 | + 2.9% | 97,678 | + 3.3% |
| Available seat-kilometers (m) | 33,523 | + 1.8% | 241,959 | + 4.0% | |
| Revenue seat-kilometers (m) | 29,240 | + 2.7% | 199,668 | + 5.0% | |
| Passenger load-factor (%) | 87.2 | +0.8pts. | 82.5 | +0.8pts. | |
| Available Cargo tonne-kilometers (m) | 1,528 | + 8.9% | 11,609 | + 8.5% | |
| Revenue Cargo tonne-kilometers (m) | 898 | + 1.5% | 7,030 | -1.6% | |
| Cargo load-factor (%) | 58.8 | -4.2pts. | 60.6 | -6.2pts. | |
| Number of flights | 106,794 | + 0.9% | 790,564 | + 2.4% | |
| Lufthansa German Airlines* | Passengers in 1,000 | 6,634 | + 1.8% | 47,918 | + 2.9% |
| Available seat-kilometers (m) | 18,805 | + 4.0% | 136,932 | + 4.1% | |
| Revenue seat-kilometers (m) | 16,323 | + 4.8% | 112,870 | + 5.1% | |
| Passenger load-factor (%) | 86.8 | +0.7pts. | 82.4 | +0.8pts. | |
| Number of flights | 48,169 | -0.7% | 374,766 | + 2.0% | |
| thereof Hub FRA | Passengers in 1,000 | 4,118 | -0.9% | 29,314 | + 1.4% |
| Available seat-kilometers (m) | 12,777 | + 0.3% | 93,512 | + 1.2% | |
| Revenue seat-kilometers (m) | 11,145 | + 1.5% | 77,586 | + 2.5% | |
| Passenger load-factor (%) | 87.2 | +1.0pts. | 83.0 | +1.1pts. | |
| Number of flights | 27,612 | -3.4% | 210,599 | -0.1% | |
| thereof Hub MUC | Passengers in 1,000 | 2,359 | + 4.5% | 17,502 | + 3.3% |
| Available seat-kilometers (m) | 5,910 | + 12.1% | 42,624 | + 10.3% | |
| Revenue seat-kilometers (m) | 5,096 | + 12.3% | 34,751 | + 10.9% | |
| Passenger load-factor (%) | 86.2 | +0.2pts. | 81.5 | +0.5pts. | |
| Number of flights | 18,500 | -0.5% | 149,631 | + 1.6% | |
| Switzerland | Passengers in 1,000 | 2,182 | + 7.0% | 14,489 | + 5.8% |
| Available seat-kilometers (m) | 5,693 | + 2.6% | 42,452 | + 6.4% | |
| Revenue seat-kilometers (m) | 5,052 | + 3.1% | 35,567 | + 6.9% | |
| Passenger load-factor (%) | 88.8 | +0.4pts. | 83.8 | +0.3pts. | |
| Number of flights | 15,924 | + 6.4% | 112,717 | + 6.3% | |
| Austrian Airlines | Passengers in 1,000 | 1,489 | + 4.7% | 9,748 | + 5.7% |
| Available seat-kilometers (m) | 2,799 | -1.0% | 19,182 | + 3.4% | |
| Revenue seat-kilometers (m) | 2,447 | + 0.3% | 15,478 | + 5.8% | |
| Passenger load-factor (%) | 87.4 | +1.1pts. | 80.7 | +1.8pts. | |
| Number of flights | 13,089 | + 3.9% | 92,999 | + 3.7% | |
| Total Network Airlines** |
Passengers in 1,000 | 10,248 | + 3.3% | 71,764 | + 3.9% |
| Available seat-kilometers (m) | 27,264 | + 3.1% | 198,328 | + 4.5% | |
| Revenue seat-kilometers (m) | 23,796 | + 4.0% | 163,729 | + 5.6% | |
| Passenger load-factor (%) | 87.3 | +0.7pts. | 82.6 | +0.8pts. | |
| Number of flights | 76,438 | + 1.5% | 575,054 | + 3.1% | |
| * Lufthansa German Airlines incl. Hub FRA, Hub MUC & regional airlines | |||||
| ** Lufthansa German Airlines incl. Hub FRA, Hub MUC & regional airlines, SWISS incl. Edelweiss Air, Austrian Airlines | |||||
| Total Eurowings* |
Passengers in 1,000 | 3,895 | + 1.8% | 25,914 | + 1.5% |
| Available seat-kilometers (m) | 6,259 | -3.5% | 43,632 | + 1.7% | |
| Revenue seat-kilometers (m) | 5,444 | -2.3% | 35,938 | + 2.6% | |
| Passenger load-factor (%) | 87.0 | +1.0pts. | 82.4 | +0.7pts. | |
| Number of flights | 30,356 | -0.5% | 215,510 | + 0.4% | |
| * Incl. Eurowings and Brussels Airlines | |||||
| Network Airlines & Cargo* | |||||
| Site na mpaghara | Ọnwa | M na | Mkpokọta | M na | |
| Europe | Passengers in 1,000 | 7,808 | + 3.8% | 54,790 | + 3.4% |
| Available seat-kilometers (m) | 8,304 | + 4.0% | 58,862 | + 5.1% | |
| Revenue seat-kilometers (m) | 6,847 | + 5.1% | 45,377 | + 4.4% | |
| Passenger load-factor (%) | 82.5 | +0.8pts. | 77.1 | -0.5pts. | |
| Available Cargo tonne-kilometers (m) | 77 | + 26.4% | 564 | + 18.6% | |
| Revenue Cargo tonne-kilometers (m) | 27 | + 8.2% | 227 | + 0.8% | |
| Cargo load-factor (%) | 35.5 | -6.0pts. | 40.2 | -7.1pts. | |
| America (North und South) |
Passengers in 1,000 | 1,239 | + 1.2% | 8,277 | + 4.0% |
| Available seat-kilometers (m) | 10,571 | + 2.9% | 74,435 | + 3.2% | |
| Revenue seat-kilometers (m) | 9,443 | + 3.7% | 63,609 | + 5.3% | |
| Passenger load-factor (%) | 89.3 | +0.7pts. | 85.5 | +1.7pts. | |
| Available Cargo tonne-kilometers (m) | 727 | + 11.0% | 5,401 | + 10.0% | |
| Revenue Cargo tonne-kilometers (m) | 399 | + 4.0% | 3,149 | + 0.5% | |
| Cargo load-factor (%) | 54.9 | -3.7pts. | 58.3 | -5.5pts. | |
| Asia / Pacific | Passengers in 1,000 | 691 | + 3.7% | 4,959 | + 4.7% |
| Available seat-kilometers (m) | 6,237 | + 3.4% | 46,889 | + 3.9% | |
| Revenue seat-kilometers (m) | 5,608 | + 3.8% | 40,098 | + 5.0% | |
| Passenger load-factor (%) | 89.9 | +0.3pts. | 85.5 | +0.9pts. | |
| Available Cargo tonne-kilometers (m) | 588 | + 1.0% | 4,558 | + 2.3% | |
| Revenue Cargo tonne-kilometers (m) | 398 | -5.9% | 3,059 | -8.0% | |
| Cargo load-factor (%) | 67.8 | -5.0pts. | 67.1 | -7.5pts. | |
| Middle East/ Africa |
Passengers in 1,000 | 510 | + 0.2% | 3,738 | + 11.0% |
| Available seat-kilometers (m) | 2,152 | + 0.5% | 18,140 | + 10.4% | |
| Revenue seat-kilometers (m) | 1,897 | + 2.1% | 14,645 | + 12.6% | |
| Passenger load-factor (%) | 88.2 | +1.4pts. | 80.7 | +1.6pts. | |
| Available Cargo tonne-kilometers (m) | 137 | + 28.4% | 1,086 | + 26.2% | |
| Revenue Cargo tonne-kilometers (m) | 73 | + 40.6% | 596 | + 29.3% | |
| Cargo load-factor (%) | 53.6 | +4.6pts. | 54.8 | +1.3pts. | |
| * Lufthansa German Airlines incl. Hub FRA, Hub MUC & regional airlines, SWISS incl. Edelweiss Air, Austrian Airlines, Lufthansa Cargo | |||||
|
Eurowings* |
|||||
| Ọnwa | M na | Mkpokọta | M na | ||
| -Zọ dị mkpụmkpụ | Passengers in 1,000 | 3,586 | + 2.8% | 23,687 | + 1.2% |
| Available seat-kilometers (m) | 4,390 | + 1.5% | 28,825 | + 1.8% | |
| Revenue seat-kilometers (m) | 3,825 | + 3.5% | 23,595 | + 2.4% | |
| Passenger load-factor (%) | 87.1 | +1.7pts. | 81.9 | +0.5pts. | |
| Ọdụdọ ogologo | Passengers in 1,000 | 309 | -8.1% | 2,227 | + 4.9% |
| Available seat-kilometers (m) | 1,869 | -13.4% | 14,807 | + 1.6% | |
| Revenue seat-kilometers (m) | 1,618 | -13.8% | 12,343 | + 2.9% | |
| Passenger load-factor (%) | 86.6 | -0.4pts. | 83.4 | +1.1pts. | |
| * Incl. Eurowings and Brussels Airlines | |||||
IHE Ị GA-Ewepụ na edemede a:
- Strongest passenger growth at Zurich hub .
- N'ihi ya, ihe na-ebu ibu ibu gosipụtara mbelata kwekọrọ, na-agbada site na 4.
- .


